matplotlib
 python

La bibliothèque
Matplotlib est une bibliothèque de tracé deux dimensions pour python.
D’une très grande richesse, elle propose en autres :
– tous les types classiques de tracé : courbes, histogrammes, diagrammes à barres, nuages de points, etc.
– un mode à la Matlab® avec pylab (utilisé dans l’exemple ci-dessous)
– une intégration facile avec des applications web et six bibliothèques d’interface graphique (Qt, gtk, etc.)
– export des figures en de nombreux formats, dont le SVG.
La documentation
La documentation de Matplotlib est excellente, surtout grâce à la galerie d’exemples illustrés : Matplotlib — Thumbnail gallery
Autres sources d’exemples et d’astuces :
– Cookbook/Matplotlib -
– Plotting data using Matplotlib : Part 2
Un exemple
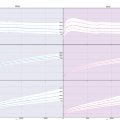
Comme exemple, je vous propose de tracer les courbes de croissance standards de l’OMS disponible au lien suivant : WHO
Sans être une référence, il y a surement mille façons de faire cela, ce script concentre de nombreuses astuces glanées au fil du temps, comme :
– sélection des couleurs dans un color map
– lecture directe des fichiers CSV
– axes partagés
– min max des axes imposés
– masquage des repères d’axe
– etc.
# -*- coding:utf-8 -*-
"""
Drawing Standard Child Grow curve with Matplotlib
More info : http://intrw.net/log/spip.php?article149
"""
import pylab


def getColor(name, n):
    # Usage name is one of the cm (colormaps) names
    # cl = getColor('jet', 4)
    # then call cl(i) with i between 1 and n
    # A list of cm is available here:
    # http://matplotlib.sourceforge.net/
    # examples/pylab_examples/show_colormaps.html
    import matplotlib.cm as cm
    return cm.get_cmap(name, lut=n+2)

# Define text box appearance
percent_box = dict(boxstyle="round",
                   ec='none',
                   fc='w',
                   alpha=0.5)

#
# Load data
#

# Load boys data
boys_bfa = pylab.csv2rec('bfa_boys_p_exp.txt', delimiter='\t')
boys_lhfa = pylab.csv2rec('lhfa_boys_p_exp.txt', delimiter='\t')
boys_wfa = pylab.csv2rec('wfa_boys_p_exp.txt', delimiter='\t')

# Load girls data
girls_bfa = pylab.csv2rec('bfa_girls_p_exp.txt', delimiter='\t')
girls_lhfa = pylab.csv2rec('lhfa_girls_p_exp.txt', delimiter='\t')
girls_wfa = pylab.csv2rec('wfa_girls_p_exp.txt', delimiter='\t')

f = pylab.figure()

#
# Boys
#

# Get boys color list
cl = getColor('PuBu', 3)

# Plot body mass index boy data
ax1 = pylab.subplot(321)
ax1.grid(True)

pylab.fill_between(boys_bfa.day, boys_bfa.p3, 0, color= cl(1), alpha=0.5)
pylab.plot(boys_bfa.day, boys_bfa.p3, color= cl(1))
pylab.plot(boys_bfa.day, boys_bfa.p15, color= cl(2))
pylab.plot(boys_bfa.day, boys_bfa.p50, color= cl(3))
pylab.plot(boys_bfa.day, boys_bfa.p85, color= cl(2))
pylab.plot(boys_bfa.day, boys_bfa.p97, color= cl(1))
pylab.fill_between(boys_bfa.day, boys_bfa.p97,
                   max(max(boys_bfa.p97), max(boys_bfa.p97))*1.2,
                   color= cl(1), alpha=0.5)

# Add percentage for BMI boy  data
pylab.text(max(boys_bfa.day)-10, boys_bfa.p3[-1:], "3%", size=10,
           ha="right", va="center",
           bbox = percent_box)
pylab.text(max(boys_bfa.day)-10, boys_bfa.p15[-1:], "15%", size=10,
           ha="right", va="center",
           bbox = percent_box)
pylab.text(max(boys_bfa.day)-10, boys_bfa.p50[-1:], "50%", size=10,
           ha="right", va="center",
           bbox = percent_box)
pylab.text(max(boys_bfa.day)-10, boys_bfa.p85[-1:], "85%", size=10,
           ha="right", va="center",
           bbox = percent_box)
pylab.text(max(boys_bfa.day)-10, boys_bfa.p97[-1:], "97%", size=10,
           ha="right", va="center",
           bbox = percent_box)

pylab.xlim(0, max(boys_bfa.day))
pylab.ylim(min(min(girls_bfa.p3), min(boys_bfa.p3))*0.8,
           max(max(boys_bfa.p97), max(boys_bfa.p97))*1.2)
pylab.title(u"Boys")
#~ pylab.xlabel(u"Days")
pylab.ylabel(u"BMI (kg/m²)")

# Plot lenght heigh boy data
ax3 = pylab.subplot(323)
ax3.grid(True)

pylab.fill_between(boys_lhfa.day, boys_lhfa.p3, 0, color= cl(1), alpha=0.5)
pylab.plot(boys_lhfa.day, boys_lhfa.p3, color= cl(1))
pylab.plot(boys_lhfa.day, boys_lhfa.p15, color= cl(2))
pylab.plot(boys_lhfa.day, boys_lhfa.p50, color= cl(3))
pylab.plot(boys_lhfa.day, boys_lhfa.p85, color= cl(2))
pylab.plot(boys_lhfa.day, boys_lhfa.p97, color= cl(1))
pylab.fill_between(boys_lhfa.day, boys_lhfa.p97,
                   max(max(girls_lhfa.p97), max(boys_lhfa.p97))*1.2,
                   color= cl(1), alpha=0.5)

# Add percentage for lenght / height boy  data
pylab.text(max(boys_lhfa.day)-10, boys_lhfa.p3[-1:], "3%", size=10,
           ha="right", va="center",
           bbox = percent_box)
pylab.text(max(boys_lhfa.day)-10, boys_lhfa.p15[-1:], "15%", size=10,
           ha="right", va="center",
           bbox = percent_box)
pylab.text(max(boys_lhfa.day)-10, boys_lhfa.p50[-1:], "50%", size=10,
          ha="right", va="center",
          bbox = percent_box)
pylab.text(max(boys_lhfa.day)-10, boys_lhfa.p85[-1:], "85%", size=10,
           ha="right", va="center",
           bbox = percent_box)
pylab.text(max(boys_lhfa.day)-10, boys_lhfa.p97[-1:], "97%", size=10,
           ha="right", va="center",
           bbox = percent_box)

pylab.xlim(0, max(boys_lhfa.day))
pylab.ylim(min(min(girls_lhfa.p3), min(boys_lhfa.p3))*0.8,
               max(max(girls_lhfa.p97), max(boys_lhfa.p97))*1.2)
#~ pylab.xlabel(u"Days")
pylab.ylabel(u"Height (cm)")

# Plot weight boy data
ax5 = pylab.subplot(325)
ax5.grid(True)

pylab.fill_between(boys_wfa.day, boys_wfa.p3, 0, color= cl(1), alpha=0.5)
pylab.plot(boys_wfa.day, boys_wfa.p3, color= cl(1))
pylab.plot(boys_wfa.day, boys_wfa.p15, color= cl(2))
pylab.plot(boys_wfa.day, boys_wfa.p50, color= cl(3))
pylab.plot(boys_wfa.day, boys_wfa.p85, color= cl(2))
pylab.plot(boys_wfa.day, boys_wfa.p97, color= cl(1))
pylab.fill_between(boys_wfa.day, boys_wfa.p97,
                   max(max(girls_wfa.p97), max(girls_wfa.p97))*1.2,
                   color= cl(1), alpha=0.5)

# Add percentage for weight boy data
pylab.text(max(boys_wfa.day)-10, boys_wfa.p3[-1:], "3%", size=10,
           ha="right", va="center",
           bbox = percent_box)
pylab.text(max(boys_wfa.day)-10, boys_wfa.p15[-1:], "15%", size=10,
           ha="right", va="center",
           bbox = percent_box)
pylab.text(max(boys_wfa.day)-10, boys_wfa.p50[-1:], "50%", size=10,
           ha="right", va="center",
           bbox = percent_box)

pylab.text(max(boys_wfa.day)-10, boys_wfa.p85[-1:], "85%", size=10,
           ha="right", va="center",
           bbox = percent_box)
pylab.text(max(boys_wfa.day)-10, boys_wfa.p97[-1:], "97%", size=10,
           ha="right", va="center",
           bbox = percent_box)

pylab.xlim(0, max(boys_wfa.day))
pylab.ylim(min(min(girls_wfa.p3), min(boys_wfa.p3))*0.8,
           max(max(girls_wfa.p97), max(girls_wfa.p97))*1.2)
pylab.xlabel(u"Days")
pylab.ylabel(u"Weight (kg)")

#
# Girls
#

# Get a girly color list
cl = getColor('PuRd', 3)

# Plot body mass index girl data
ax2 = pylab.subplot(322)
ax2.grid(True)

pylab.fill_between(girls_bfa.day, girls_bfa.p3, 0, color= cl(1), alpha=0.5)
pylab.plot(girls_bfa.day, girls_bfa.p3, color= cl(1))
pylab.plot(girls_bfa.day, girls_bfa.p15, color= cl(2))
pylab.plot(girls_bfa.day, girls_bfa.p50, color= cl(3))
pylab.plot(girls_bfa.day, girls_bfa.p85, color= cl(2))
pylab.plot(girls_bfa.day, girls_bfa.p97, color= cl(1))
pylab.fill_between(girls_bfa.day, girls_bfa.p97,
                   max(max(girls_bfa.p97), max(boys_bfa.p97))*1.2,
                   color= cl(1), alpha=0.5)

# Add percentage for BMI girl data
pylab.text(max(girls_bfa.day)-10, girls_bfa.p3[-1:], "3%", size=10,
           ha="right", va="center",
           bbox = percent_box)
pylab.text(max(girls_bfa.day)-10, girls_bfa.p15[-1:], "15%", size=10,
           ha="right", va="center",
           bbox = percent_box)
pylab.text(max(girls_bfa.day)-10, girls_bfa.p50[-1:], "50%", size=10,
           ha="right", va="center",
           bbox = percent_box)
pylab.text(max(girls_bfa.day)-10, girls_bfa.p85[-1:], "85%", size=10,
           ha="right", va="center",
           bbox = percent_box)
pylab.text(max(girls_bfa.day)-10, girls_bfa.p97[-1:], "97%", size=10,
           ha="right", va="center",
           bbox = percent_box)

pylab.xlim(0, max(girls_bfa.day))
pylab.ylim(min(min(girls_bfa.p3), min(boys_bfa.p3))*0.8,
           max(max(girls_bfa.p97), max(boys_bfa.p97))*1.2)
pylab.title(u"Girls")
# No label
#~ pylab.xlabel(u"Days")
#~ pylab.ylabel(u"Body mass index (kg/m²)")

# Plot lenght heigh girl data
ax4 = pylab.subplot(324)
ax4.grid(True)

pylab.fill_between(girls_lhfa.day, girls_lhfa.p3, 0, color= cl(1), alpha=0.5)
pylab.plot(girls_lhfa.day, girls_lhfa.p3, color= cl(1))
pylab.plot(girls_lhfa.day, girls_lhfa.p15, color= cl(2))
pylab.plot(girls_lhfa.day, girls_lhfa.p50, color= cl(3))
pylab.plot(girls_lhfa.day, girls_lhfa.p85, color= cl(2))
pylab.plot(girls_lhfa.day, girls_lhfa.p97, color= cl(1))
pylab.fill_between(girls_lhfa.day, girls_lhfa.p97,
                   max(max(girls_lhfa.p97), max(boys_lhfa.p97))*1.2,
                   color= cl(1), alpha=0.5)

# Add percentage for lenght / height girl data
pylab.text(max(girls_lhfa.day)-10, girls_lhfa.p3[-1:], "3%", size=10,
           ha="right", va="center",
           bbox = percent_box)
pylab.text(max(girls_lhfa.day)-10, girls_lhfa.p15[-1:], "15%", size=10,
           ha="right", va="center",
           bbox = percent_box)
pylab.text(max(girls_lhfa.day)-10, girls_lhfa.p50[-1:], "50%", size=10,
           ha="right", va="center",
           bbox = percent_box)
pylab.text(max(girls_lhfa.day)-10, girls_lhfa.p85[-1:], "85%", size=10,
           ha="right", va="center",
           bbox = percent_box)
pylab.text(max(girls_lhfa.day)-10, girls_lhfa.p97[-1:], "97%", size=10,
           ha="right", va="center",
           bbox = percent_box)

pylab.xlim(0, max(girls_lhfa.day))
pylab.ylim(min(min(girls_lhfa.p3), min(boys_lhfa.p3))*0.8,
           max(max(girls_lhfa.p97), max(boys_lhfa.p97))*1.2)
# No label
#~ pylab.xlabel(u"Days")
#~ pylab.ylabel(u"Length/height (cm)")

# Plot weight girl data
ax6 = pylab.subplot(326)
ax6.grid(True)

pylab.fill_between(girls_wfa.day, girls_wfa.p3, 0, color= cl(1), alpha=0.5)
pylab.plot(girls_wfa.day, girls_wfa.p3, color= cl(1))
pylab.plot(girls_wfa.day, girls_wfa.p15, color= cl(2))
pylab.plot(girls_wfa.day, girls_wfa.p50, color= cl(3))
pylab.plot(girls_wfa.day, girls_wfa.p85, color= cl(2))
pylab.plot(girls_wfa.day, girls_wfa.p97, color= cl(1))
pylab.fill_between(girls_wfa.day, girls_wfa.p97,
                   max(max(girls_wfa.p97), max(boys_wfa.p97))*1.2,
                   color= cl(1), alpha=0.5)

# Add percentage for weight girl data
pylab.text(max(girls_wfa.day)-10, girls_wfa.p3[-1:], "3%", size=10,
           ha="right", va="center",
           bbox = percent_box)
pylab.text(max(girls_wfa.day)-10, girls_wfa.p15[-1:], "15%", size=10,
           ha="right", va="center",
           bbox = percent_box)
pylab.text(max(girls_wfa.day)-10, girls_wfa.p50[-1:], "50%", size=10,
           ha="right", va="center",
           bbox = percent_box)
pylab.text(max(girls_wfa.day)-10, girls_wfa.p85[-1:], "85%", size=10,
           ha="right", va="center",
           bbox = percent_box)
pylab.text(max(girls_wfa.day)-10, girls_wfa.p97[-1:], "97%", size=10,
           ha="right", va="center",
           bbox = percent_box)

pylab.xlim(0, max(girls_wfa.day))
pylab.ylim(min(min(girls_wfa.p3), min(boys_wfa.p3))*0.8,
           max(max(girls_wfa.p97), max(boys_wfa.p97))*1.2)
pylab.xlabel(u"Days")
# No label
#~ pylab.ylabel(u"Weight (kg)")


pylab.subplots_adjust(hspace=0.001, wspace=0.001)

#
# Personalise graph
#

# Main title
pylab.figtext(0.5, 0.960, 'Standard Grow Curves',
              ha='center', color='black', weight='bold', size='large')

# Hide non wished tick labels
xticklabels = (ax1.get_xticklabels() + ax2.get_xticklabels()
             + ax3.get_xticklabels() + ax4.get_xticklabels())
pylab.setp(xticklabels, visible=False)
yticklabels = (ax2.get_yticklabels()
             + ax4.get_yticklabels()
             + ax6.get_yticklabels())
pylab.setp(yticklabels, visible=False)

#
# Finally display graph
#
pylab.show()P.-S.
Les liens directs vers les fichiers utilisés dans le script :
– lhfa boys [txt 104kb] : http://www.who.int/entity/childgrowth/standards/lhfa_boys_p_exp.txt
– lhfa girls [txt 104kb] : http://www.who.int/entity/childgrowth/standards/lhfa_girls_p_exp.txt
– wfa boys [txt 97kb] : http://www.who.int/entity/childgrowth/standards/wfa_boys_p_exp.txt
– wfa girls [txt 97kb] : http://www.who.int/entity/childgrowth/standards/wfa_girls_p_exp.txt
– bfa boys [txt 101kb] : http://www.who.int/entity/childgrowth/standards/bfa_boys_p_exp.txt
– bfa girls [txt 101kb] : http://www.who.int/entity/childgrowth/standards/bfa_girls_p_exp.txt

